Maps
The information below describes an interactive map that was previously available on the Civil War Washington website. The map was removed from the website in 2025. Map data can be downloaded from the data page.
Maps, map-making, and cartography played crucial roles in the Civil War, and we believe they play similarly important roles in the current study and understanding of the war-time capital. Civil War Washington has created a project geographical information system (GIS), which combines historical maps and historical information with modern technology. The dynamic map interface allows users to examine digitized period maps of the District, to move between current and historical views, and to select one or more feature layers (such as hospitals, theaters, and freedmen's villages) and view information about these locations. Tools for search and analysis are also available. Read more...
How to use the map
The Civil War Washington mapping application has been designed for a range of users, from the casual browser to the serious researcher. This tutorial introduces users to key functionality of the application. If you have questions or comments about the maps or this tutorial, please contact the project team.
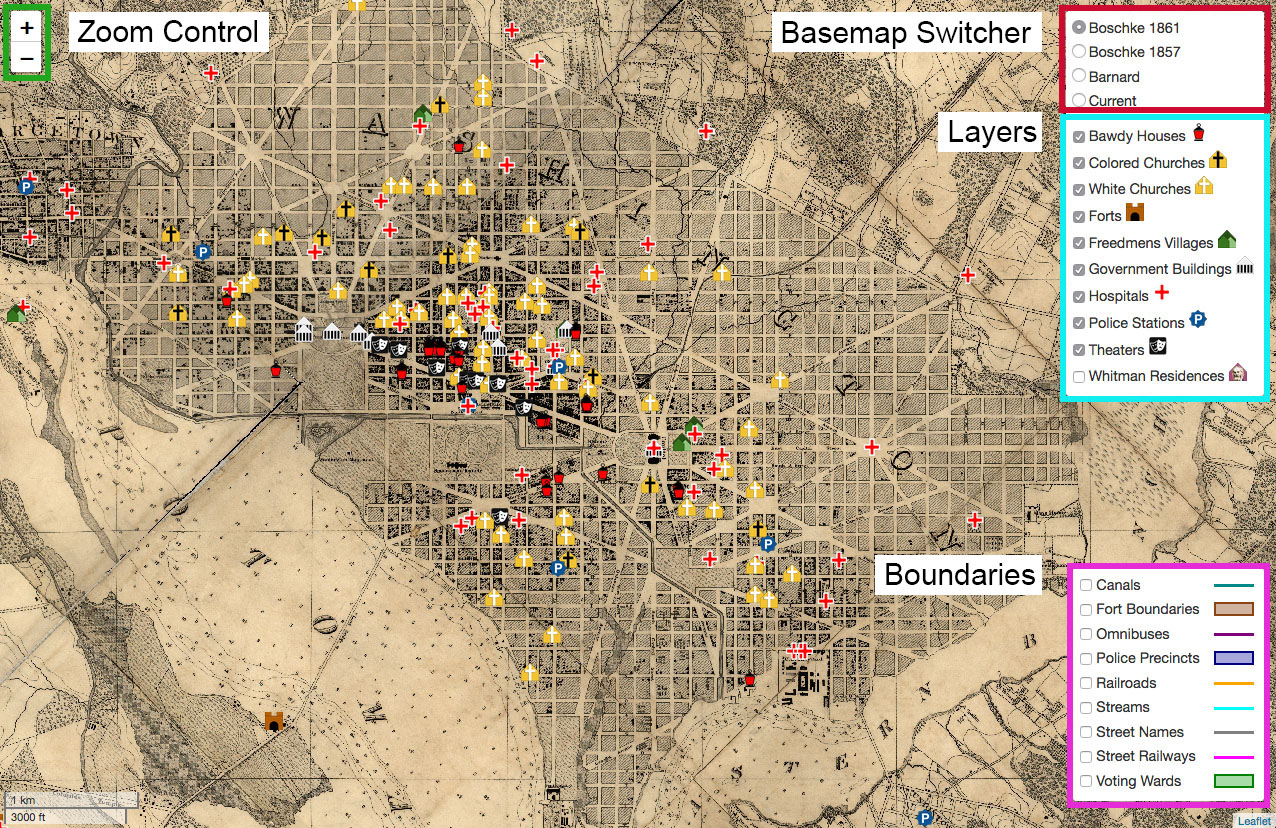
Figure 1: Primary features of the map.
Users will interact with 4 main control layers in order to explore available historical data and achieve custom map views. These control layers are highlighted in Figure 1 above.
Zoom Control
A navigation feature on the left side of the mapped area allows for zooming the map, although, like many major mapping applications, users may also choose to use common click-and-drag and double-click methods to pan and zoom, respectively. Users with scroll button mice will be able to scroll to zoom in and out.
Basemap Switcher
The basemap switcher control layer at the top right allows users to choose from among several basemap views (background maps upon which data are drawn), including three historical basemaps, and a modern basemap, allowing for quick comparison.
Layers
Using the Layers controls, you may toggle off or on any of the data layers you are interested in.
Boundaries
As with the Layers above, toggling the boundaries will show or hide them. These are all off by default.
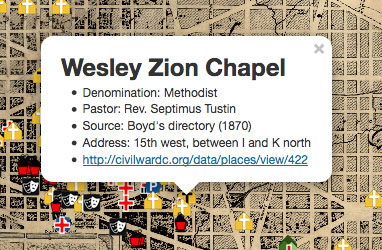
Figure 2: Informational popup.
Clicking on a map item will bring up an informational popup with available data. Some items have a link to further information from our Data section.